Event metrics is a significant reason behind most event organizers choice of app and platform.
If it’s not high on your agenda you might be missing out on an opportunity to improve the way you organize your conference or trade show.
Why? Because a key element of good ROI is having clear information about the way your attendees engage or disengage.
Whatever you call it, audience insights, data analytics, metrics dashboards the goals are the same. First. understand what your visitors and participants need and what they get. Once you know what’s working and what isn’t you can improve (some people call this process “optimization”.)
When you do that, you’re in a much better position to deliver an experience that serves the needs of the most important people in your event: attendees, sponsors, and exhibitors.
This is not just about targeted marketing, lead generation, and efficient management of resources. While these are crucial, the point being is to listen - and act.
A word of advice before we start. We discussed in previous posts the need to respect and protect the privacy of your app’s users.
The EU’s Global Data Protection Regulation (GDPR) is not just a hot topic but also a binding legal framework and a reality.
Advanced data-exchange and geolocation technologies might have a revolutionizing impact. They also pose challenges and demands on organizers.
So, when it comes to analytics, be smart and respectful and don’t hesitate to ask your app providers about the intricate details of data privacy and protection.
With that in mind, let’s move on to the issue at hand. What are the main problems and advantages associated with metrics?
Event audience analysis: Where we were and where we are
Onsite event analytics used to be something of a black hole. Event organizers would use digital means to manage the before and after of their events, but not during.
Now, with the advent of event apps and near-universal smartphones, this issue can be solved. But wait. Getting that information is one thing, knowing what to do with it is quite another.
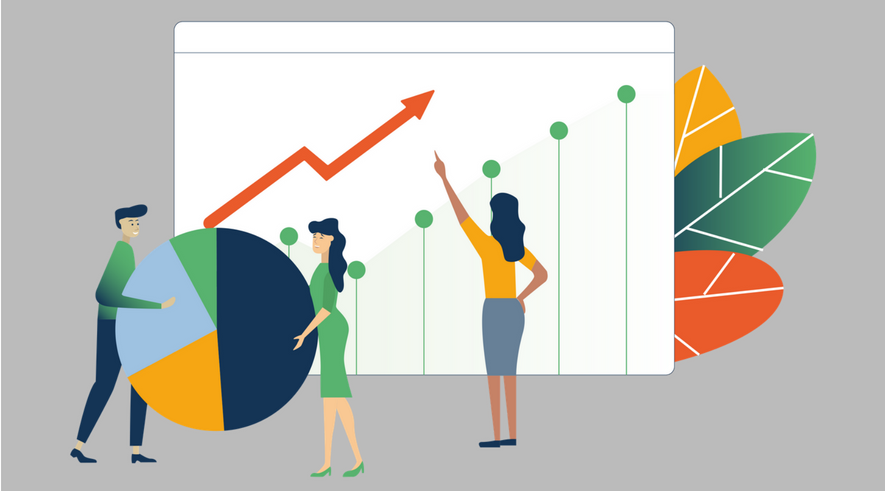
Thankfully there are ways to break down your data into more meaningful values. Rather than looking at a sea of graphs and charts, by applying real-life understanding of your event to your data you can get some useful and actionable insights.
Do that, and you can move up one level, from analysis to synthesis. SImply put, event planners can combine various sources of information to apply your analytics data for the most event success. The idea is to avoid the much-dreaded silos and have a bird-eye view of everything you do, from pre-event registration, through interaction during sessions until well after the event is over.
Step one: Create a digital event strategy
Before you start looking at event tech solutions, it’s important to consider and set strategic goals for your event data. Are you trying to boost ticket sales, calculate a no-show rate or experiment with new event design? These are going to require various types of data and different applications.
Make sure to discuss with your event app and platform provider what sort of analytics they can provide and consider how you will use them.
Think about how you might use the data in a strategic way. Event app metrics can tell you a great deal about your audience. Hence, insights should be relevant to all your interactions with attendees, partners or sponsors.
-
Contain lots of incentive for low effort interaction (reaction polls on Facebook rather than leave a comment)
-
Start early to plot how results changed across the development of the event
-
Not focus on vanity metrics - try not to obsess about the how many pages were viewed on your website.
The one question is, always: am I providing a valuable, memorable experience? Do I help people meet and interact? That’s where your insights should lead you.
Step two: Use direct and indirect means of calculation
Analytics isn’t just a question of graphs and percentages. Most of the data you will receive in the course of your event is likely to be indirect. In-app conversations tell you a lot about how successful networking was. Consider how usage rates might reflect about how your attendees use technology and what they appreciate.
Step three: Distinguishing qualitative feedback from quantitative data
Feedback forms have always been ingrained in event management and rightly so. It’s always good to hear from attendees in their own words. Regardless, be wary of relying on vague questions.
More objective information yielded in event app metrics can be better in situations where you’re trying to answer specific questions concerning your audience. Asking whether someone was satisfied with the event overall is more likely to yield a simple ‘yes’ rather than a proper comment which takes longer to write. As a result, there’s a risk your data will end up biased.
Similarly, workshop responses can be highly influenced by who is running it or fellow participants.
By contrast, rather than ask whether people enjoyed the session, you can look at how many people downloaded the slide deck. This is probably a better indicator of event engagement.
- Yields general impressions and new insights
- Good for rapidly developing and testing hypotheses
-
Answers very specific questions rather than give a broad overview
-
Objective
-
Good for proving what you already suspect about your event (but do stay open to surprises)
Step four: Create smarter content
It’s rare for any business to get a significant chunk of their audience all in one place and all thinking about their industry. Events are a great opportunity to research what your audience is actually talking about.
If you are using a live question or poll app, this can be a great way to get ideas for future blog posts, videos, and marketing campaigns.
Look at which polls or questions received the largest response (positive or negative) as much as percentage wins in a poll. This gives you great indicators as to what your audience is likely to engage in.
Step five: Listen to social
On a similar note, make sure to set up your social listening services early on in the promotion of your event. They are a useful counterpart to event app metrics.
There are a huge number of tools available to do this.
Social listening can give you insight into what your attendees are interested in and what they’re discussing in relation to your event.
This should give you insight into the match - or gap - between what your guests expect and what the event provides. You can do this within Swapcard using an integrated Twitter feed.
Conclusion
How you use event app metrics and other forms of analytics concerning your event is likely to be highly personalized. Nobody knows your attendees better than you.
Hence, you are best placed to interpret nuances in data. Be aware of extraneous factors that may compromise or bias your results. Be sure to communicate with your event app provider for the best results - we can help on that, of course.
Last but not least, feel free to check out Swapcard’s new dashboards, where you can find all the metrics that matter in one place.


